Essential QA Tools for Effective Software Testing
As someone just getting started in QA, I understand it can feel like a daunting field. I have a business administration background, so the ins and outs of software development are decidedly not my forte. Obviously, I’d have a lot of questions. One of my primary questions when I first jumped into testing our software was, “What tools do I use as I test this stuff?” While not every QA engineer is going to use the same methodology, there are a few essential QA tools that are useful no matter how a QA Engineer searches to uncover bugs. Here I highlight 3 of these tools shown to me by a senior QA engineer that our team utilizes daily: Chrome DevTools, Snagit and ApowerMirror.
Chrome DevTools

QA engineers who are going to spend a lot of time with web apps will be on the hunt for bugs in browsers like Chrome, Safari, and Firefox. With about 60% of market share, Chrome is the go-to browser for many people. I do a majority of my testing in Chrome, and its DevTools have been key in relaying information about bugs to our software engineers.
What makes Chrome DevTools useful?
Chrome DevTools are useful in that they give you information you can share with your colleagues, providing them with an efficient starting point in identifying and addressing the issue. We value our time spent finding bugs; we should value a developer’s time spent trying to fix them.
Additionally, the DevTools enable you to simulate common mobile devices or add your own. This can give you a quick idea of how the software will look and perform in a mobile environment. It’s no replacement for testing on actual mobile devices, but it provides a quick look without having to wrangle up multiple phones or tablets.
How do I use Chrome DevTools?

There are multiple ways to access DevTools. While exploring the software in Chrome, hit F12 early in your journey if on a Windows machine or option-command-I ( ⌥⌘I ) if you’re a Mac user. Alternatively, take the scenic route: open the Chrome Menu in the upper right-hand corner of the browser window and select More tools > Developer tools to bring up the browser’s DevTools.
As seen in Figure 1, you now have a view of what the software is doing. Here, my main focus is on the Network tab so I can see the various elements of the page as they load. If an error occurs, the request line will be red, and you can click the Response tab in the Network view to see what error message the software is causing. Figure 2 shows a typical error message response from Chrome DevTools. You can include these responses when you write up your bug.
Snagit
Chrome DevTools might help you identify a bug, but what’s next? How can you relay that information to the developers? Writing out the steps to produce the bug is a good place to start. But you can do more. Showing developers the bug provides additional information they can use as they work to correct the problem you uncovered.
What makes Snagit useful?
Snagit helps you do just that – provide a visual of the bug. As a screen capture tool, Snagit enables you to record any bugs you encounter, whether a relatively minor display error or a back breaking functional error.
Snagit can also accelerate your workflow, with customizable keyboard shortcuts and full screen screenshots with page scrolling. You can even drag images directly out into other applications.
How do I use Snagit?
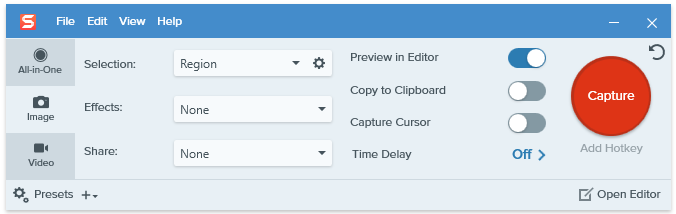
From the capture window (Figure 3), simply select whether you want to take an image or record video. Then, click the capture button. If capturing an image, you simply choose the area of your screen you want to record. For video, you’ll need to press a record button in the area you chose to capture.
When opening a page results in data from multiple columns overlapping each other, that’s a good scenario to use Snagit’s image capture. If, instead, the flow is open a dialog>change a field>save>navigate to a different page, Snagit’s video capture will be your preferred option. In either instance, you can edit what you captured to help draw focus to where it’s needed. Once you finalize the image or video that demonstrates the problem you found, be sure to include it when you write up the bug to give the developers a bit of an assist in visualizing the issue.
ApowerMirror
Mobile devices are ubiquitous in today’s world, so it’s imperative to look at how software performs in a mobile environment. Although Chrome DevTools can simulate a variety of mobile devices, there’s no substitute for testing on the real thing. But, switching back and forth between a laptop and mobile device during testing can be a hassle. Not to mention, recording and sharing bugs you encounter on mobile can be a bit of an effort.
What makes ApowerMirror useful?
ApowerMirror is a screencasting tool compatible with both iOS and Android, enabling you to see your mobile device on your work computer. For Android devices, it can be used to remotely control the device with a keyboard and mouse. And if you pay for the premium version, you can mirror up to 4 devices simultaneously.
How do I use ApowerMirror?
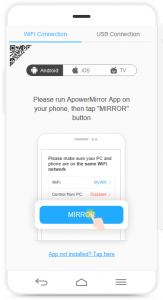
ApowerMirror utilizes an app on your mobile devices and your work computer and can function with just a WiFi connection. In the desktop app (Figure 4), choose iOS or Android for the mobile device you want to mirror, then open the mobile app on your device of choice. Once the connection is made between the two, you’re good to go. To navigate an Android device with your mouse and keyboard, connect that device to your computer via USB. Unfortunately, such control is not available for iOS devices at the time of this writing.
When you’re successfully mirroring your mobile device (Figure 5), you can then use Snagit to capture images or video of your bug-producing processes in the mobile environment just as you did when you were testing web apps on your work computer. Now, mobile screen capturing is relatively painless.

Now Get Testing
While by no means an exhaustive list, those discussed here are a good introduction to essential QA tools that will prove handy for a QA Engineer. Chrome DevTools, Snagit and ApowerMirror have undoubtedly served the team well in identifying and documenting bugs. I hope that by identifying these essential QA tools, I can provide some guidance and lessen the stress for others who, like me, may be just starting on a QA career.
 Strategy for Modernizing Monolithic Applications
 The "Frankenstein" Cloud Software Application